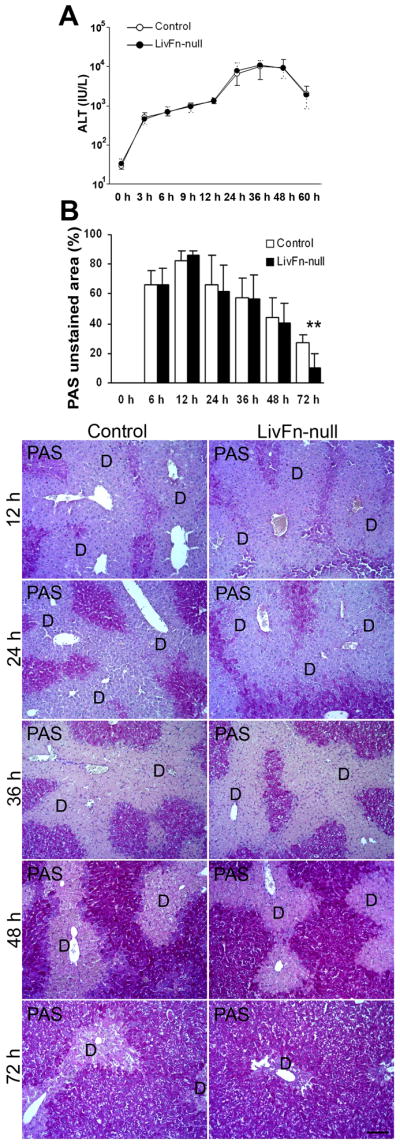
Fig. 3. Analysis of liver damage following acute injury.

(A) Serum ALT levels in control and fibronectin-null mice post injury. Data are means±S.D. (n=10 for each group).
(B) Upper panel: Time course of the quantification of damaged areas using Periodic Acid-Schiff (PAS)-stained tissue sections. Data are the means±S.D. (n=5 for each group). **, P<0.01. Lower panels: PAS staining of livers at 12, 24, 36, 48, and 72hrs after injury. D, damaged areas. Bar=100μm.
