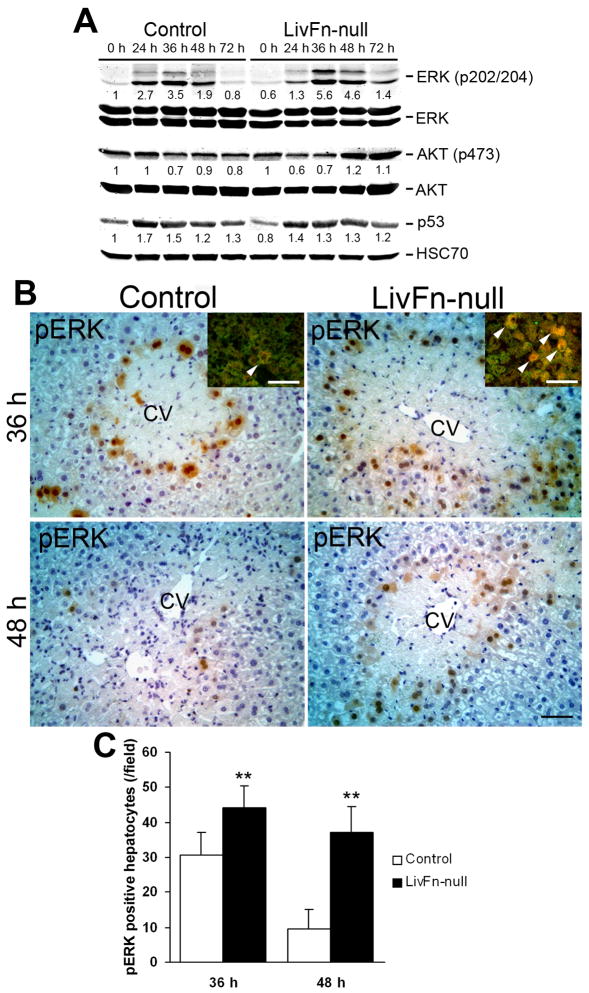
Fig. 6. Analysis of intracellular signalings following liver injury.
(A) Western blot analysis of phospho-ERK (pERK), total ERK, phospho-Akt (pAkt), total Akt, p53, and HSC70 (loading control) in control and mutant livers. Pooled samples from 3 mouse livers from each strain were used for the analysis. Band intensity was measured by densitometry, and each pERK and pAkt intensity was normalized to total ERK and total Akt, respectively; each p53 intensity was normalized to HSC70. Then the intensity at 0hr in the control liver was set to 1. Each intensity is shown relative to the control value.
(B) Immunostaining for pERK (in brown) at 36 and 48hrs post injury Sections were counterstained with hematoxylin. CV, central vein. Bar=50μm. Inset: Double immunofluorescence staining for pERK (in red) and albumin (in green) in control and fibronectin-null livers at 36hrs post injury. Arrowheads indicate double-positive hepatocytes (orange to yellow color). Bar=50μm.
(C) Analysis of pERK-positive hepatocytes. Data are means±S.D. (cells/field; field=0.14mm2 [n=5 for each group]). **, P<0.01.

