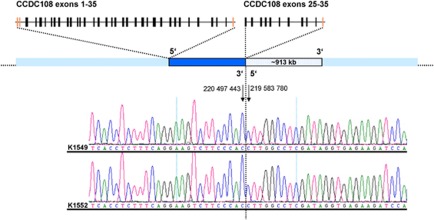
Figure 4.
Illustration of identified tandem duplications. Schematic overview of genomic position of the analyzed tandem duplication. The duplicated segment is depicted in dark blue, the duplication is shown in dotted blue. Chromatograms of K1549 and K1552 show the identical breakpoints proving tandem orientation of the duplication. The break point is designated by a black line. The genomic positions of the 5′ and 3′ break points are given, and the corresponding bases are indicated by arrows. The 5′ breakpoint is located within exon 25 of CCDC108 (schematic presentation on top) and the intact and the partially duplicated copy of CCDC108 are displayed. The color reproduction of this figure is available at the European Journal of Human Genetics journal online.

