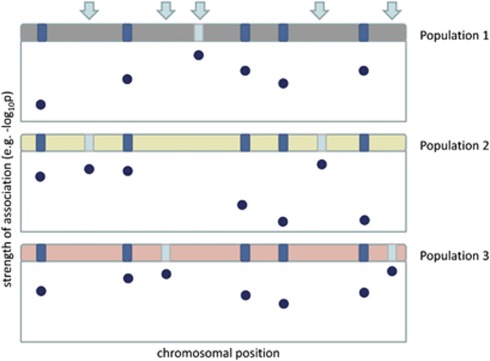
Figure 1.
Schematic overview of allelic heterogeneity in a chromosomal region implicated in disease across three populations. Variants are represented by dark and light blue boxes. Causal variants are population-specific (shown in light blue and indicated by arrows, N=5) and the strongest signal of association is found for a different variant in each population (the y axis describes the strength of association).

