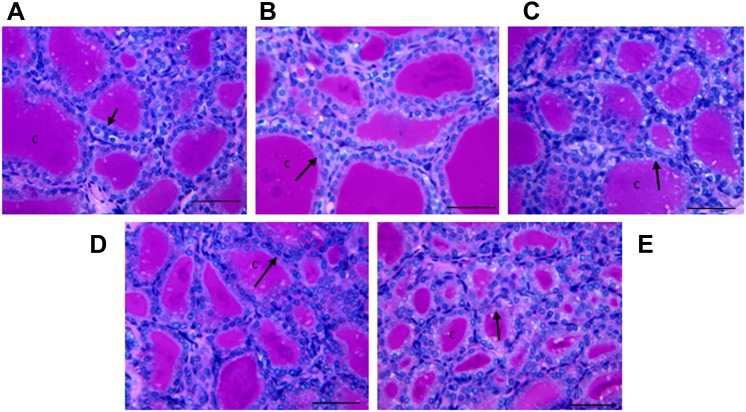
FIG. 6.
Light micrographs (×200, periodic acid Schiff staining) of the inner follicles of thyroid glands of control (A) and BFR-treated males (B) 0.02, (C) 0.2, (D) 2.0, or (E) 20 mg/kg/day. “c” indicates follicular colloid in the acellular lumen, whereas the arrow indicates the single layer of cuboidal epithelium that surrounds and encloses the follicle. Bar = 50 μm.

