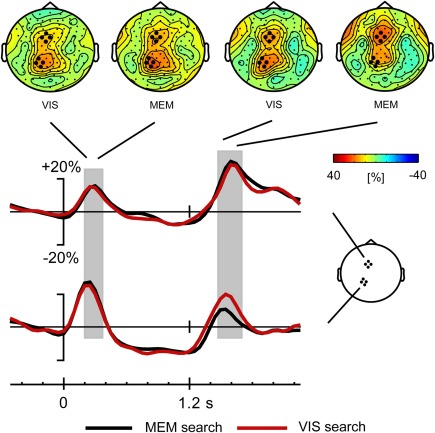
Figure 5.
Time course of theta activity for Visual search and Memory search task versions, with scalp distributions of the theta synchronization phases following precue and response cue; grand average data across all subjects. The theta synchronization following the response cue is due to the 2- and 4-target conditions only (see Figure 6). The gray blocks indicate the time windows for analysis of the theta synchronization.

