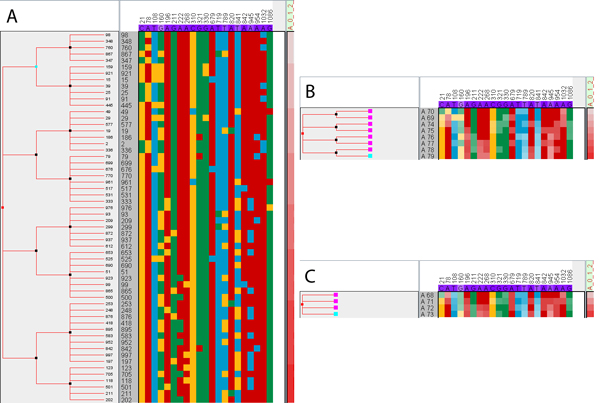
Figure 5.
Aggregation and correlation. Aggregation of rows and columns can be used to find correlations between sequence data and metadata. Aggregating metadata columns in (A) shows the distribution of "overall virulence", for which the causing SNPs in the sequence are of interest. Aggregating rows (B,C) according to the dendrogram (which was computed in advance for the purpose of demonstration) leads to a condensed view where it is possible to find similar patterns between positions in the sequence and the metadata. For example, column 841 shows an inverse pattern to the "overall virulence". Going back to the expanded view now allows the user to investigate the cause of the patterns, where sequence position 841 shows a binary distribution with many yellow spots in the bottom half and some outliers in the top.

