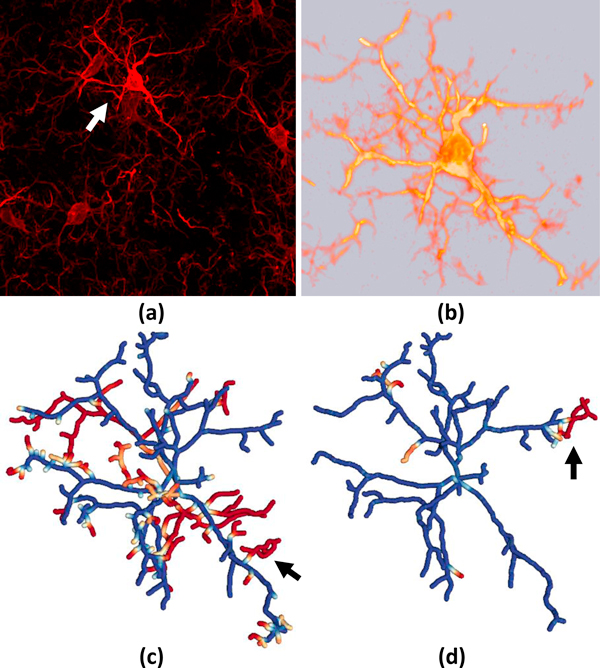
Figure 13.
Comparing two manually-constructed models of microglia. Both models were traced using Neuromantic by human operators. (a) A maximum intensity projection of the original confocal image stack and (b) a volume visualization of the target microglia. (c-d) The geometric error is shown on both models.

