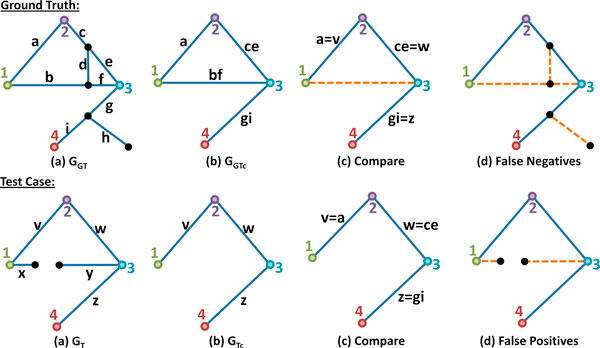
Figure 6.
Evaluating the core connectivity. (a) Graph coloring uses a nearest-neighbor search to associate nodes in the test case to those in the ground truth. Nodes with color C(v) ≥ 0 are inserted into Gc.(b-d) A breadth-first searche is used to find connected neighbors among the colored vertices. The edges forming the shortest path to each neighbor are combined to form a single graph in Gc. The use of edge weights in the computation biases the selection of edges to those that have a high degree of geometric correspondence between the two networks.

