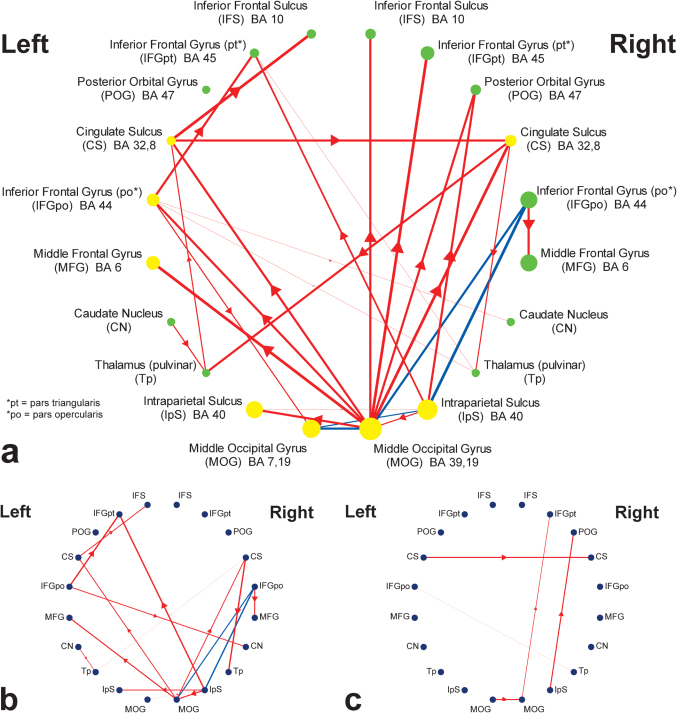
Figure 2. Topographical representations of causal connectivity maps.
ROIs are positioned based on their order along the coronal axis. (a) Group-level causal connectivity and sensitivity to task-demand. ROIs show regions with linear increase in activity in response to increased task complexity (FDR, P < 0.05). Yellow circles represent demand-sensitive ROIs where their activation significantly increased along with RT (FDR, P < 0.05). Green circles represent non-significant correlations with RT. The radius of the circles is proportional to the mean t-value of selected voxels within each ROI across all VSRT conditions. Directional influences are represented by red lines with thickness proportional to significance (FDR, P < 0.05). Blue lines represent significant bidirectional connections (FDR, P < 0.05). (b) Connectivity map of fast performers. Group-level connections were explored to detect those that are part of fast performers' connectivity network (P < 0.01). (c) Connectivity map of slow performers (P < 0.01).

