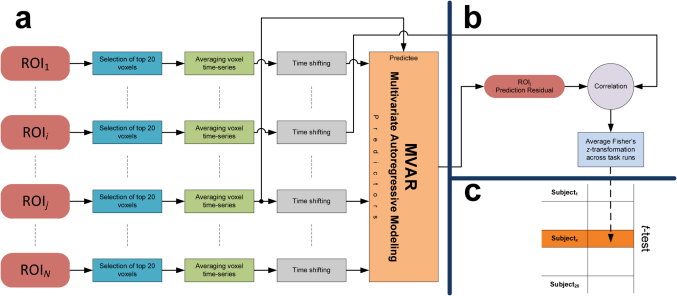
Figure 3. Group-level investigation of causal influence of ROIi on ROIj (N = 20).
(a) Schematic of the multivariate Granger causality (MGC) at the subject-level (Subjectx). Initially, the predictability components of other possible interacting regions (except ROIi) were removed using multivariate auto regressive modeling (MVAR). (b) The residual signal was correlated with lagged time-series from ROIi to obtain the parameter estimate for unique causal influence of ROIi on ROIj. (c) Significant causal influences were then determined using a two tailed t-test comparing the mean of Fisher's z-transformed correlations against zero (FDR, P < 0.05).

