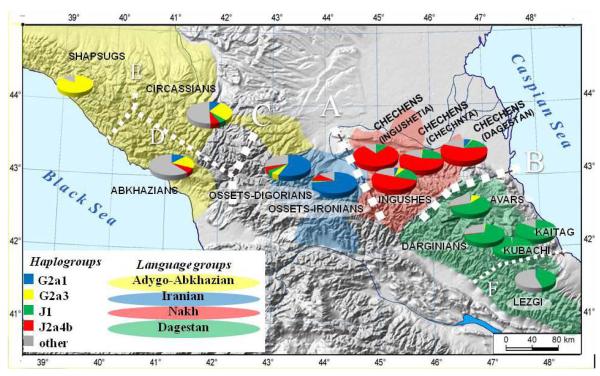
Figure 1. Geographic location, linguistic affiliation and genetic composition of the studied populations.
Each population is designated by a pie chart representing frequencies of the major haplogroups in it. Areas of the linguistic groups of the Caucasus (except for Turkic groups) are shown by semi-transparent color zones. Black dotted lines indicate genetic boundaries identified in the barrier analysis (thick lines – most important boundaries A, B and C; thin lines – other boundaries D, E and F).

