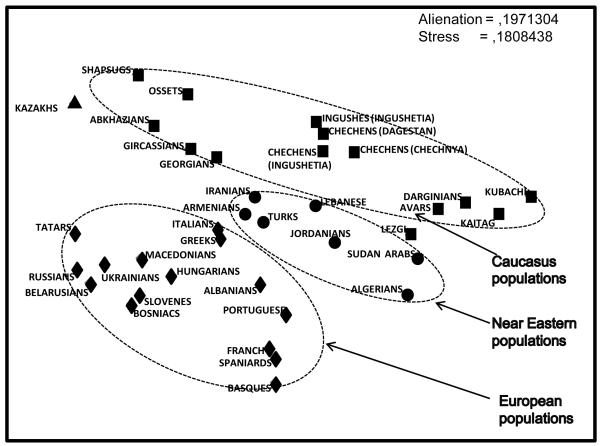
Figure 3. MDS plot depicting genetic relationships between Caucasus, Near Eastern and European populations.
The plot is based on Nei’s pairwise genetic distances calculated from frequencies of thirteen Y chromosomal haplogroups (C, E, G, I, J1, J2, L, N1c, O, R1a1, R1b1, Q, other) in populations of North Caucasus (this study), Transcaucasus (Georgians, Battaglia et al., 2009), Near East (this study; Cinnioglu et al., 2004; Flores et al., 2005), and some other European, African and Asian populations (data from Y-base, compiled in our lab from published sources). Caucasus populations are shown by squares, Near Eastern populations by circles and European populations by diamonds.

