
Figure 5.
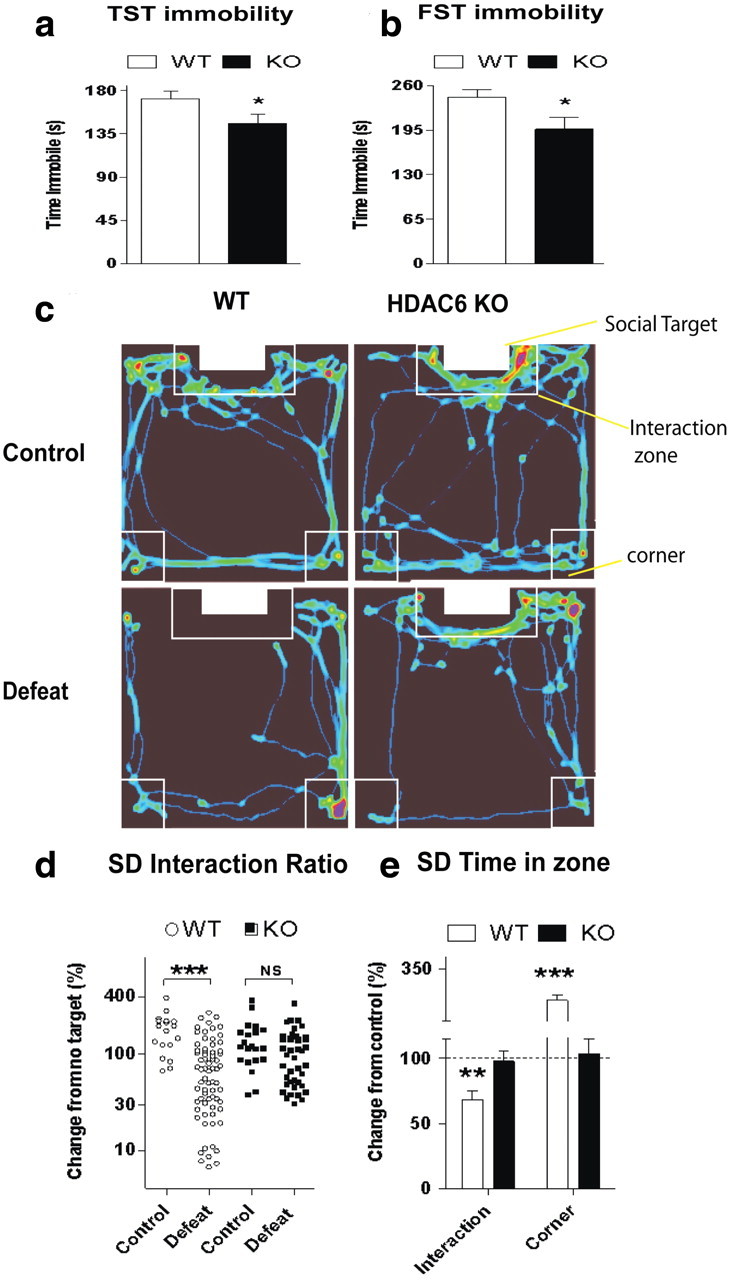
Antidepressant-like phenotype in HDAC6Pet1Cre KO mice. a, b, Decreased immobility of HDAC6Pet1Cre KO compared with WT mice in two despair tests, the TST (a) and FST (b) (*p < 0.05 compared with WT; n = 15 per condition). c, Representative videotracking heat maps from WT and HDAC6Pet1Cre KO mice exposed to a social target. The red/yellow colors identify the locations where mice spent the most time. Exposure to chronic social defeat reduced time in the interaction zone in a genotype-dependent manner. Note how high-density traces remain localized to the interaction zone after social defeat in the HDAC6Pet1Cre KO, whereas they shift to the corner zone in the WT. d, Distribution of individual interaction ratios in WT and HDAC6Pet1Cre KO genotypes. Interaction ratios were comparable between control mice of both genotypes (WT, n = 18; KO, n = 21). Social defeat decreased interaction ratios in WT (control, n = 18; defeat, n = 70; p < 0.001) but had no significant effect in HDAC6Pet1Cre KO mice (control, n = 22; defeat, n = 42; NS). e, Time spent by defeated mice in the interaction zone versus corner zones of the arena in the “target present” condition. Scores of defeated WT and HDAC6Pet1Cre KO are normalized to controls within each genotype. WT mice decreased their average time in the interaction zone and correspondingly increased their time spent in the corners of the arena distant from the social target. In contrast, no significant defeat-induced change was observed in HDAC6Pet1Cre KO mice (**p < 0.01, ***p < 0.001, compared with controls). Error bars indicate SEM.