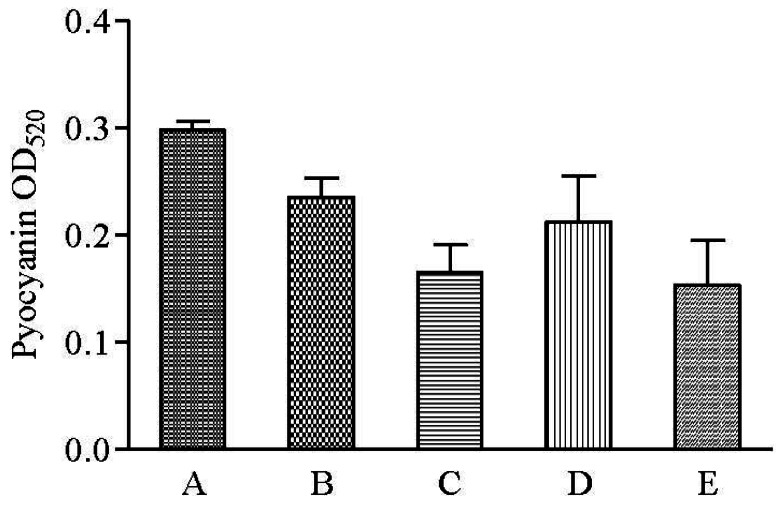
Figure 7.
Inhibition of P. aeruginosa PAO1 pyocyanin production by various extracts of clove. Bar chart represents the mean of results from triplicate cultures of three independent experiments, with error bars representing standard deviations (n = 3), (A) P. aeruginosa PAO1 (no addition of solvents or extracts); (B) DMSO; (C) Hexane extract; (D) Chloroform extract; (E) Methanol extract.

