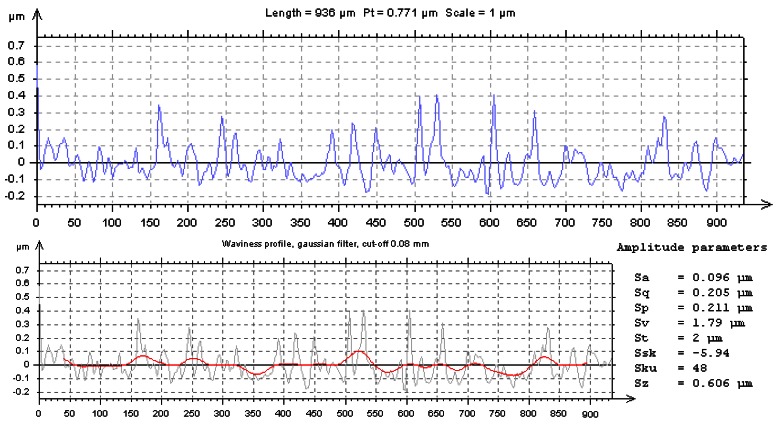
Figure 9.
Profile on the oblique line sketched on the right map of Figure 8(c) is shown here presenting also, below, the waviness profile obtained applying a double a gaussian filter and a 0.08 mm cut-off (red line). Statistical amplitude parameter obtained from the inspection of an area of the original relief map away from the fracture region (the rectangle on the right map of Figure 8).

