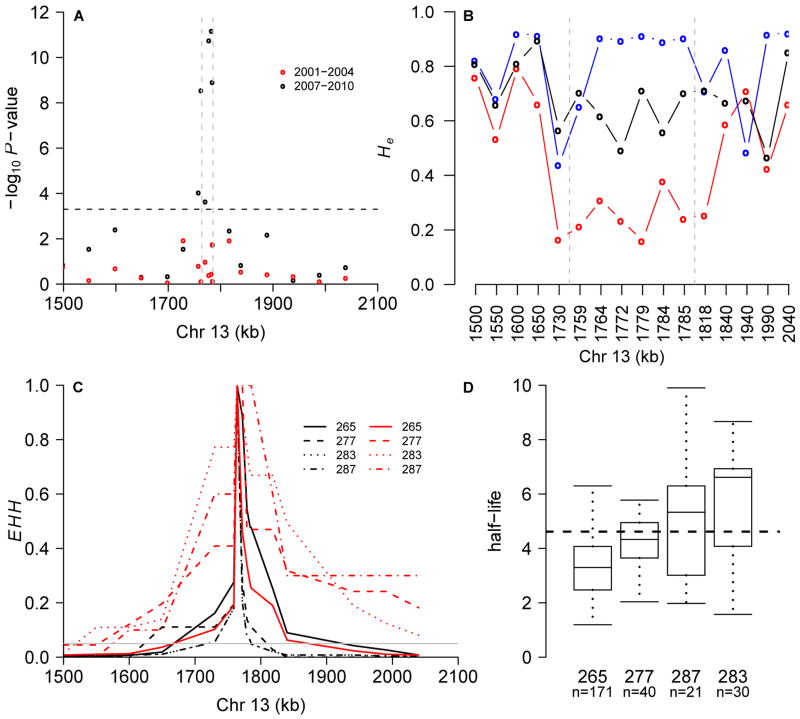
Figure 4.
Fine mapping using 19 microsatellites. A) Association P-values from the early (2001-4; red dots) and late (2007-10; black dots) periods in northern Thai population. Bonferroni-correction threshold is shown by dashed line. B) Comparison of He in Thailand, Laos and Cambodia. C) EHH surrounding a microsatellite (position 1,763,950) in slow (half-life>4.6 hours) and fast (half-life<2.3 hours) clearing parasites. D) Phenotypic distribution at this locus in 2007-10 (P=4×10-12).

