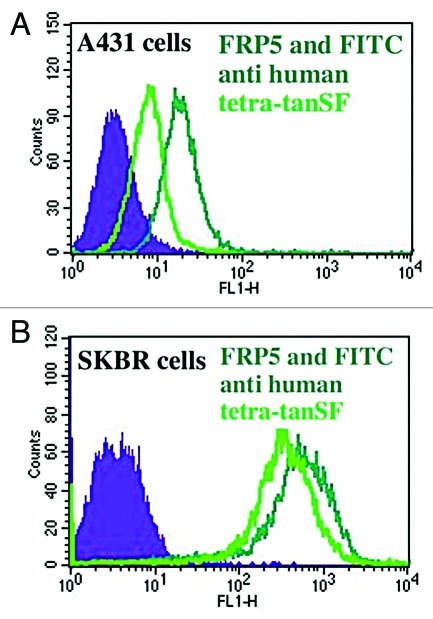
Figure 10. FACS comparison of tetra-tanSF with FITC polyclonal antibodies. (A) A431 cells stained with FRP5 and FITC-labeled secondary antibodies (mean fluorescence intensity 26) or with FRP5-tetra-tanSF fusion protein (mean fluorescence intensity 17). (B) SKBR3 cells stained with FRP5 and FITC-labeled secondary antibodies (mean fluorescence intensity 626) or with FRP5-tetra-tanSF (mean fluorescence intensity 422). Filled areas, negative control (Cell auto fluorescence).

An official website of the United States government
Here's how you know
Official websites use .gov
A
.gov website belongs to an official
government organization in the United States.
Secure .gov websites use HTTPS
A lock (
) or https:// means you've safely
connected to the .gov website. Share sensitive
information only on official, secure websites.
