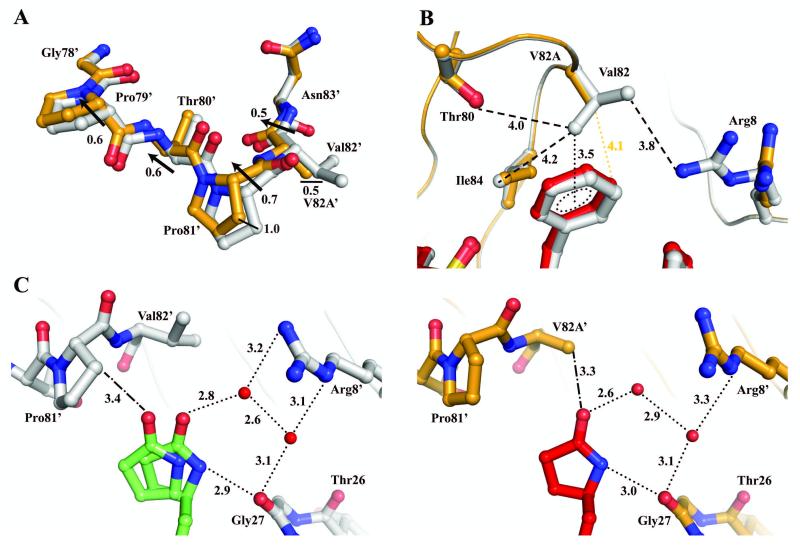
Figure 5.
Comparison of interactions of Val82 and Ala82. PRWT/1 is colored in gray and green, and PRV82A/1 is colored in orange and red. Hydrogen bond and C-H…π interactions are denoted by dotted lines and van der Waals contacts are indicated by dashed lines with interatomic distances given in Å. C-H…O interactions are denoted by dashed-dotted lines. Black arrows denote a difference in Cα position between the two superimposed structures. Only the major orientation of inhibitor is shown for clarity. Red spheres represent water molecules. (A) Superposition of PRWT and PRV82A monomer 1′-99′ illustrates a movement in the 80’s loop. (B) PRWT/1 showing van der Waals contacts between Val82 and neighboring residues, and C-H…π interaction between Val82 and P1 group of inhibitor. PRV82A/1 loses van der Waals interactions and has increased distance from V82A to neighboring residues. (C) Left panel, PRWT/1 illustrates the alternative conformation of inhibitor P1′ group. Right panel, PRV82A/1 illustrates the single conformation of inhibitor P1′ group with hydrogen bond network to Gly27 and Arg8′.

