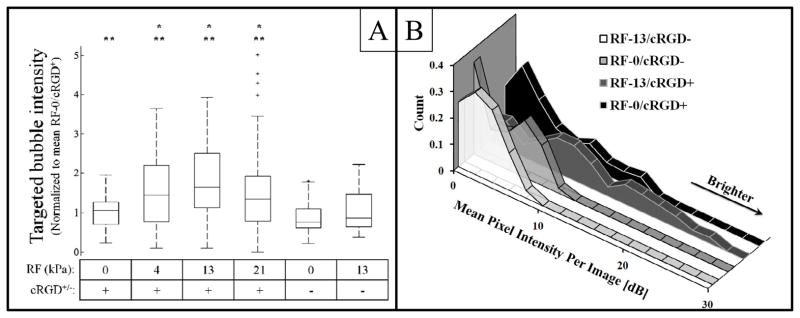
Figure 4.
A: A box and whiskers plot displaying the distribution of all mean intensities within baseline-subtracted targeted bubble images collected in this study. Data is normalized to the mean pixel intensity within the 0 kPa/cRGD+ dataset collected in each study. Asterisks indicate a statistically significant increase in targeting (p<0.05) over: * - the RF-0/cRGD+ data, ** - the RF-0/cRGD− data. B: A comparison of the histograms of pixel intensities for all image slices used in studies using control and targeted microbubbles with and without radiation force at 13 kPa. These histograms are area-normalized (not intensity normalized), and show a larger proportion of bright pixel values when targeted bubbles are used, and even more when radiation force is used with targeted bubbles.

