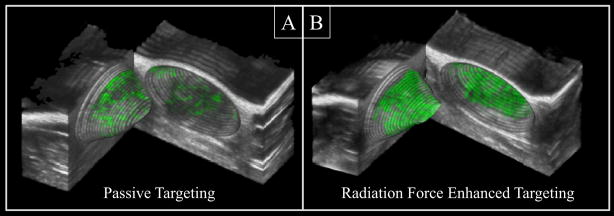
Figure 5.
A side-by-side comparison of two 3D conically-stratified hinged cutaway images. B-mode images (grayscale) are registered to the corresponding CPS images acquired 10 minutes after contrast injection (green). In both of these images, the same dose of targeted microbubbles was administered to the same animal. Radiation force was not applied in image A, and was applied at 13 kPa in image B. The imaging field of view was 1.2 cm × 1.1 cm × 1.2 cm.

