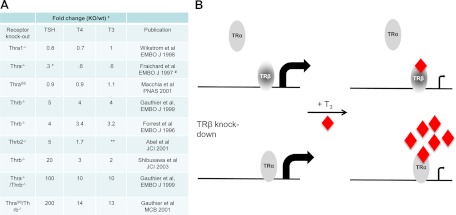
Fig. 9.
A, Summary of available THR KO mouse models. This table compares the circulating TSH and TH levels unless otherwise indicated, with values expressed as an approximate fold change relative to wild-type controls. Where possible, the authors' original values have been used; otherwise, we have chosen to estimate based on the available data. Methodologies for measurement vary substantially. *, Tshb mRNA levels; **, not measured; #, substantial postnatal death reported (values from 3 wk old mice used for this table). B, Model for the relative roles of THRA and THRB in T3-mediated down-regulation of the Tshb gene.

