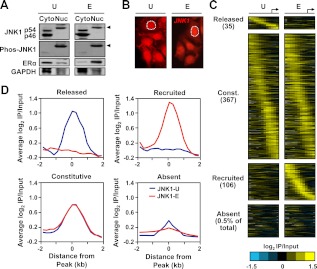
Fig. 1.
Estrogen signaling regulates the JNK1 genomic localization program in MCF-7 cells. A, MCF-7 cells were treated with vehicle (U) or E2 (E) for 45 min. Cytoplasmic (Cyto) and nuclear (Nuc) extracts were made from both conditions and analyzed by Western blotting for JNK1 and phospho-JNK1. Arrows indicate the migration of phosphorylated JNK1. ERα was used as a control for cytoplasmic and nuclear fractionation, and glyceraldehyde-3-phosphate dehydrogenase (GAPDH) was used as a loading control. B, Immunofluorescent staining of JNK1 (red signal) in MCF-7 cells before and after E2 treatment. One of the nuclei in each panel is denoted by a white dotted line. C, Analysis of promoter-proximal JNK1-binding sites in MCF-7 cells before and after E2 treatment by ChIP-chip using Nimblegen promoter arrays containing approximately 19,000 unique promoters tiled from 2200 bp upstream to 500 bp downstream of the TSS (arrow). The data are shown as heatmaps of the JNK1 ChIP-chip log2 enrichment ratios in both treatment conditions for all promoters with significant binding in either condition, and for 0.5% of JNK1-absent promoters. They are shown in categories of released, constitutive (Const.), recruited, and absent based on the fold changes of ChIP-chip signals between the E and U conditions. The promoters in each category are aligned by their positions relative to the TSS and ordered from those with the 5′-most JNK1 peak to those with the 3′-most JNK1 peak. D, Peak-centered averaging graphs (metagene analyses) of the log2 enrichment ratios from regions in the categories shown in C. The probe signals are centered on JNK1 peaks and averaged for all promoters across the region from −2 to + 2 kb relative to the JNK1 peak.

