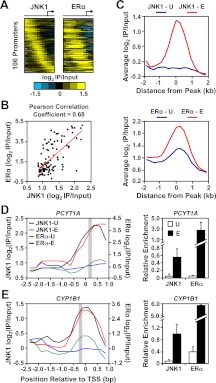
Fig. 2.
JNK1 recruitment correlates with ERα occupancy at target promoters in MCF-7 cells. A, Analysis of promoter-proximal JNK1 and ERα binding in MCF-7 cells. JNK1 and ERα ChIP-chip data from E2-treated MCF-7 cells for the 106 “JNK1-recruited” promoters from Fig. 1C are shown as heatmaps of log2 recruitment ratios aligned and ordered as in Fig. 1C. B, Pearson correlation analysis of the JNK1 and ERα ChIP-chip log2 recruitment ratios from A. C, Metagene analyses of the log2 enrichment ratios of JNK1 (top) and ERα (bottom) ChIP-chip data for the JNK1-recruited promoters from Fig. 1C before (U, in blue) and after (E, in red) E2 treatment. The probe signals are centered on the JNK1 peaks in both the JNK1 and ERα graphs. D and E, ChIP-chip (left) and ChIP-qPCR (right) analyses of JNK1 and ERα at two JNK1-recruited gene promoter regions (PCYT1A in D and CYP1B1 in E) in MCF-7 cells treated with vehicle (U) or E2 (E). The average JNK1 ChIP-qPCR signals (right) of peak regions defined by ChIP-chip (gray boxes in left panels) are consistent with the array profiles. For the ChIP-qPCR analyses, each bar represents the mean ± sem, n = 3.

