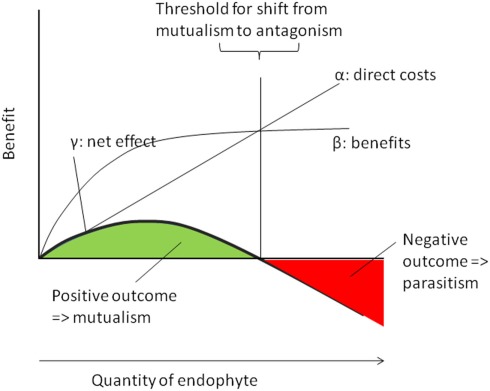
Figure 3.
Dose–response relations in plant–endophyte interactions. Endophytes cause direct metabolic costs that should be directly correlated to their abundance within the host (α) whereas their benefits are likely to follow a saturation curve (β). Therefore, the resulting net benefit (γ) follows an optimum curve and is predicted to reach positive values at low and intermediate densities (green area => mutualistic densities of the endophyte) but negative values (red area => antagonistic densities) at high (antagonistic) infection densities.

