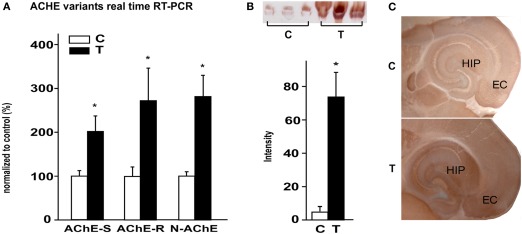
Figure 1.
AChE up-regulation 48 h post SE. (A) expression levels of AChE-S, AChE-R, and N-AChE 48 h after SE, as revealed by real-time RT-PCR (p = 0.05, 0.053, and 0.025 respectively; n = 5 controls, n = 3 or 4 treated; mean ± SEM; Mann–Whitney test). (B) Top: Karnovsky–Roots staining on non-denatured activity gel of control and 48 h after SE samples. Bottom: gel quantification (p = 0.05; n = 3; mean ± SEM; Mann–Whitney test). (C) Karnovsky–Roots staining of 200 μm horizontal brain sections from control and 48 h post SE mice. C, control; T, treated.

