Figure 3.
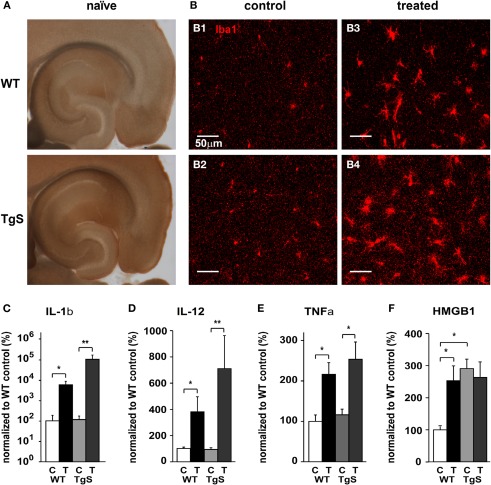
Compared microglia status in WT and TgS mice. (A) Karnovsky–Roots staining of 200 μm horizontal brain sections from naïve WT and TgS mice. (B) Iba1 staining in the hippocampus of control WT (B1), control TgS (B2), treated WT (B3), and treated TgS (B4) mice. (C–F) Real-time RT-PCR for key inflammatory cytokines. (C) IL-1β mRNA relative levels (*p = 0.014; **p = 0.004). (D) IL-12 mRNA relative levels (*p = 0.014; **p = 0.004). (E) TNFα mRNA relative levels. WT: p = 0.027, TgS: p = 0.054. (F) HMGB1 mRNA relative levels. p < 0.05 (see text). (WT: n = 5 controls, n = 4 treated, TgS: n = 6 controls/treated. In F; TgS control: n = 4; C, control; T, treated; Statistical analysis was done using the non-parametric Mann–Whitney test, mean ± SEM.)

