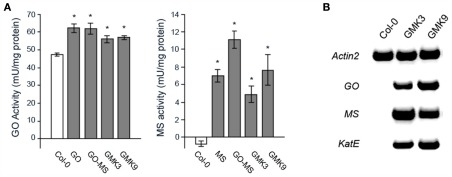
Figure 2.
(A) Glycolate oxidase (GO-) and malate synthase (MS-) activity in rosettes of transgenic and wild type plants. The values presented are the means ± SE of at least 8 plants each. Asterisks indicate significant differences to the wild type values (Student’s t-test P < 0.05). (B) Expression of the transgenes in the GMK lines assessed by RT-PCR. RNA was extracted and reversed transcribed as described in Section “Materials and Methods.” Full-length GO (1.3 kb), MS (1.8 kb), and KatE (2.4 kb) cDNA fragments were amplified by 32 cycles. As loading control Actin 2 was amplified by 29 cycles.

