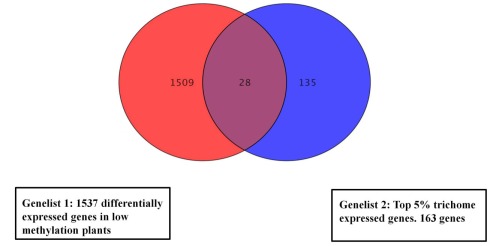
Figure 4.
Venn diagram showing overlapping expression changes of genes between low methylation plants and a trichome specific set. For the overlap search all genes with significant change were used from the low methylation versus wild type dataset (1537 genes). The central region corresponds to genes with changed expression in both trichomes and low methylation plants. The gene list is in Table S5 in Supplementary Material.

