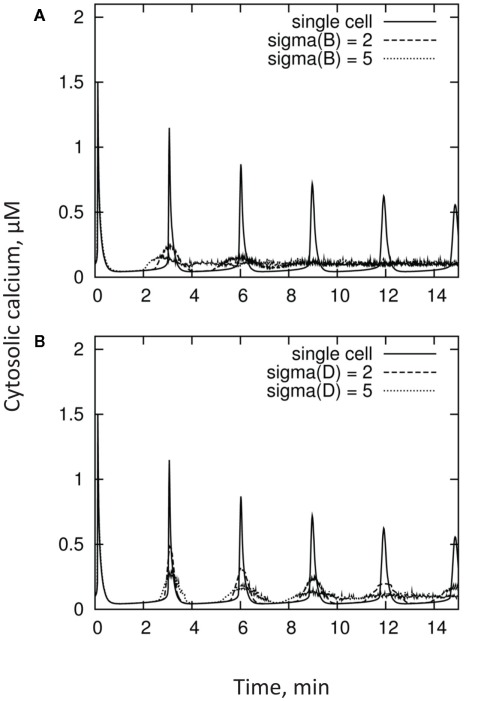
Figure 6.
Kinetics of [Ca2+]cyt measured from a population of n = 100 cells having a Gaussian (normal) distribution of parameters B panel (A) and D panel (B), as compared with individual cell responses. Distributions in these parameters broaden the first [Ca2+]cyt peak, and result in substantial decorrelation at subsequent maxima.

