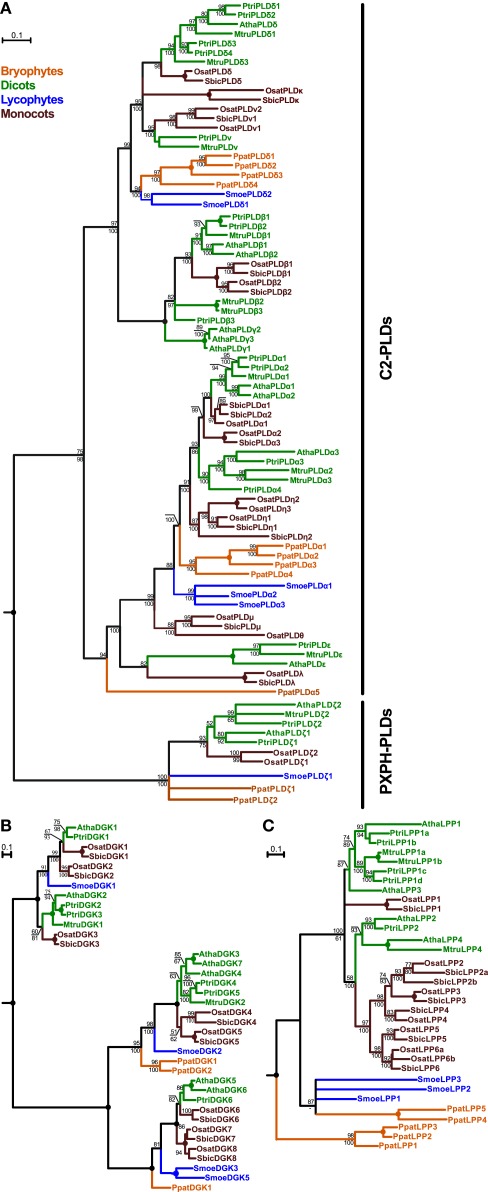
Figure 1.
Phylogenetic analysis of plant PLDs (A), DGKs (B), and LPPs (C). All trees represent the protein maximum likelihood (ML) phylogeny of particular genes. Numbers at nodes correspond to the approximate likelihood ratio test with the SH-like (Shimodaira–Hasegawa-like) support from ML (top) and posterior probabilities from Bayesian analysis (bottom). Missing values indicate support below 50%, a dash indicates that a different topology was inferred by Bayesian analysis. Circles represent 100% support by both methods. Branches were collapsed if the inferred topology was not supported by both methods. The tree in (A) was rooted using human PLD1 as an outgroup; the trees in (B) and (C) were rooted using human DGKε and yeast LPP1, respectively. Scale bars indicating the rates of substitutions/site are shown in corresponding trees. Species abbreviations: Atha, Arabidopsis thaliana; Mtru, Medicago truncatula; Osat, Oryza sativa; Ppat, Physcomitrella patens; Ptri, Populus trichocarpa; Smoe, Selaginella moellendorffii; Sbic, Sorghum bicolor.

