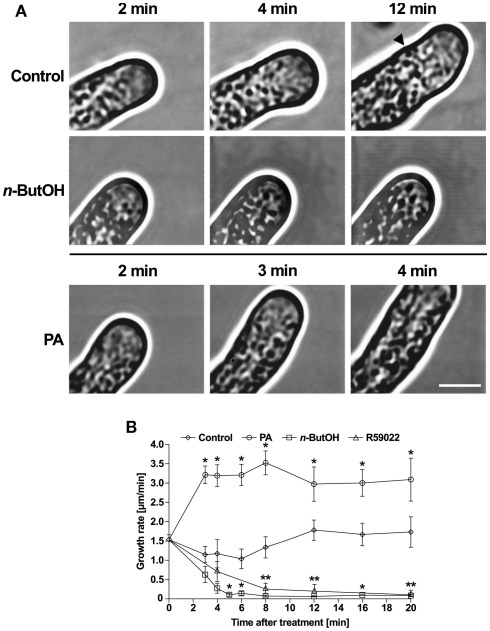
Figure 8.
Alterations in PA levels in tobacco pollen tubes result in changes in the growth and architecture of the cell. (A) Time-series analysis of pollen tubes treated with n-ButOH or PA by video-enhanced contrast microscopy. Ninety-minute-old cells were treated with 0.5% n-ButOH, 50 μM PA, or control medium and imaged after indicated times. The image field for control cells had to be shifted after 8 min of imaging and the starting position of the pollen tube tip after the shift is marked. At least six pollen tubes were imaged for each treatment and representative pictures are shown. (B) Growth rates of cells after treatments with n-ButOH, R59022 or PA. Data points represent the mean values of at least six pollen tubes ± SEM. Significant difference from the control samples is indicated by an asterisk (ANOVA, Tukey–Kramer test, p < 0.05). Scale bar = 5 μm.

