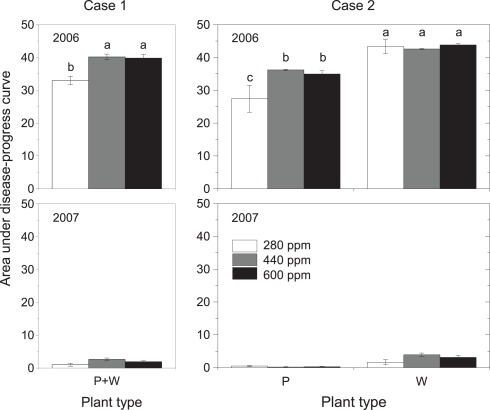
Figure 3.
Area under disease-progress curve (AUDPC) as affected by maternal CO2 concentration (280, 440, 600 ppm, Case 1; left panels) and maternal CO2 × plant type (P = pink flowering, W = white flowering, Case 2; right panels) in 2006 and 2007. AUDPC was calculated according to Eq. 1. Mean ± 1 SE, n = 3 model ecosystems. Non-identical letters indicate statistically significant differences among maternal CO2 concentrations (left panels) or combinations of maternal CO2 treatments and plant type (right panels) as analyzed by the Tukey–Kramer HSD test (P ≤ 0.05 within mixed models, see Table 4).

