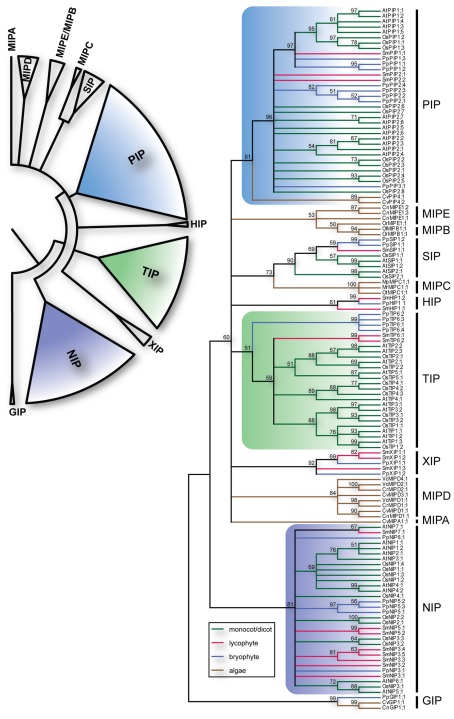
Figure 1.
Phylogeny of MIPs. The upper left panel summarize the different subfamilies of plant MIPs. The right panel depicts the bootstrap consensus tree of the complete set of MIPs from O. sativa (Os), A. thaliana (At), S. moellendorffii (Sm), P. patens (Pp) and the chlorophyte algae Chlamydomonas reinhardtii (Cr), Volvox carteri (Vc), Coccomyxa sp. C-169 (Cc), Chlorella sp. NC64A (Cn), Micromonas pusilla CCMP1545 (Mp), Micromonas sp. RCC299 (Mr), Ostreococcus lucimarinus (Ol), Ostreococcus sp. RCC809 (Or), and Ostreococcus tauri (Ot) using the Maximum Likelihood method. The branches are colored according to from what phyla the sequences are derived. The numbers by the nodes are bootstrap support in percentage and nodes with less the 50% support are collapsed. The vertical lines to the right delimit the different subfamilies.

