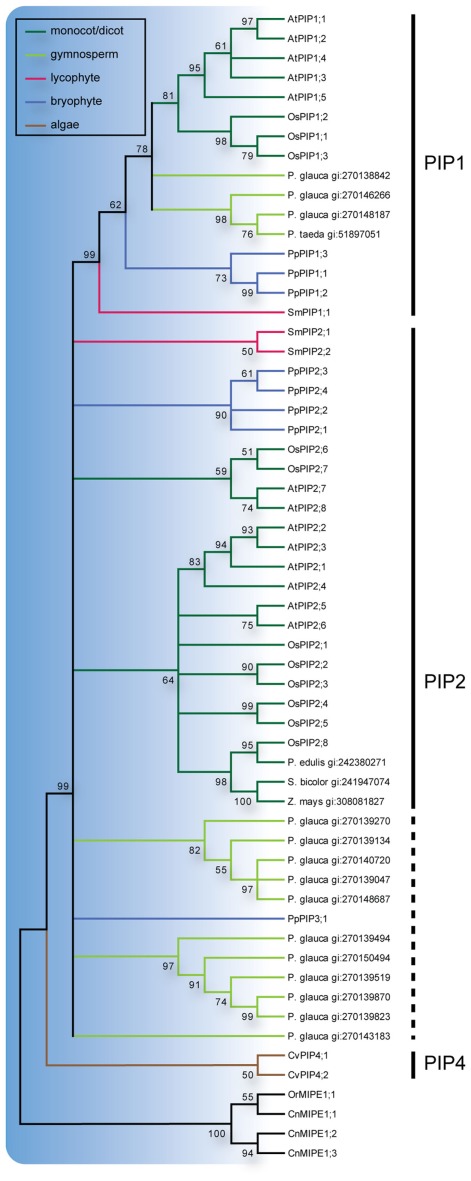
Figure 2.
Phylogeny of PIPs. Maximum Likelihood bootstrap consensus tree of PIPs from plant species with sequenced genomes together with PIP-like sequences retrieved from the NCBI EST database. EST sequences are named with species name followed by their GenBank gi numbers. The PIP branches are color coded according to from what phyla the sequences are derived. Subgroups are delimited by the vertical lines to the left where the dashed line indicates sequences for which classification is uncertain. The robustness of nodes is denoted with bootstrap support in percentage and nodes with less than 50% support are collapsed.

