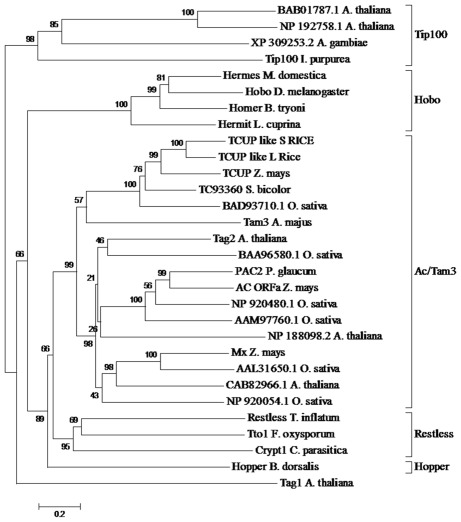
Figure 3.
Phylogenetic analysis of hAT transposases from multiple genera. The accessions chosen for this tree were based on previous analysis performed by Xu and Dooner (2005). The different clades of hAT transposases are marked with brackets. The values in each bracket represent percentage of times the clade is present among 1000 bootstraps.

