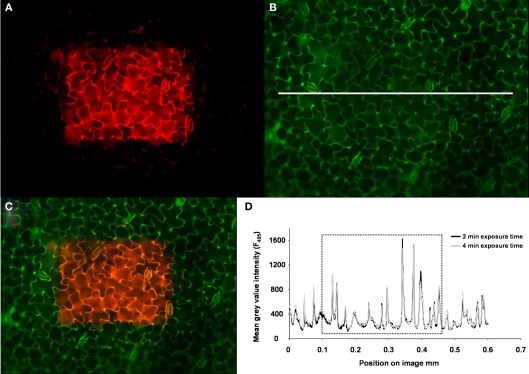
Figure 10.
Photostability of the fluorescent ion indicator. (A) To test whether the dye was prone to bleaching, a selected area in the middle of the specimen (presented in pseudo-red) was continuously excited by 495 nm illumination over a period of 2 min. The outer edges of the specimen were not illuminated because the field diaphragm foreclosed the illumination of this area, thus representing the control area of the leaf (control area = dark area within the image). (B) After 2 min continuous excitation, the field diaphragm was opened for collecting an image at ex 495 nm (exposure time was 25 mS). The image is presented in pseudo-green and contains the part of the specimen that was continuously illuminated plus the adjacent edges of the specimen that were not exposed to the continuous illumination at ex 495 (control). Image (C) presents the merged overlay of (A, B). The pseudo-orange area (mixing pseudo-red and pseudo-green yields orange) represents the part of the leaf with the possibly bleached dye, whereas the pseudo-green area represents the control part of the leaf. Image (B) was used to create a profile of the gray-value intensity from the area tagged by the white line as a measure for the dye signal intensity after 2 min of continuous excitation at 495 nm (dark-gray profile) and after 4 min of continuous excitation (light-gray profile). The gray-value intensity profiles are presented in (D). The dotted rectangle in (D) flags the gray-value intensity from the region that was exposed to continuous illumination. The gray-value intensity outside of the rectangle represents the control values. A comparison of the signal intensities between the possibly bleached part of the specimen and the control reveals that no dye-bleaching had actually occurred after 2 min of continuous illumination. This was also confirmed after 4 min.

