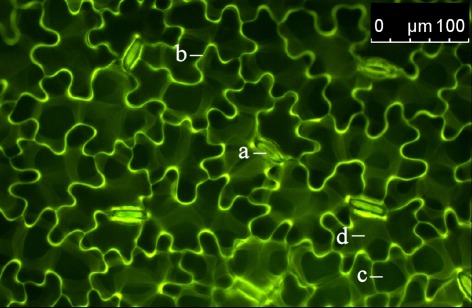
Figure 3.
Distribution of the dextran-conjugated dye Oregon Green 488 at 1.5 h after the loading event. Adaxial leaf face. Overlay of pseudo-green fluorescence image at ex 495 nm and pseudo-red fluorescence image at ex 440 nm. Images were collected at the leaf edges adjacent to the area that was loaded with the dye. The detection of dye emission signals at an area that was not loaded with the dye itself indicates that the dye is mobile within the leaf apoplast. This allows apoplastic pH to be measured in areas of the leaf apoplast not affected by the dye loading. a, stomatal apparatus; b, epidermal apoplast; c, palisade cell (dark structure; no dye signal); d, apoplast surrounding palisade mesophyll.

