Figure 4.
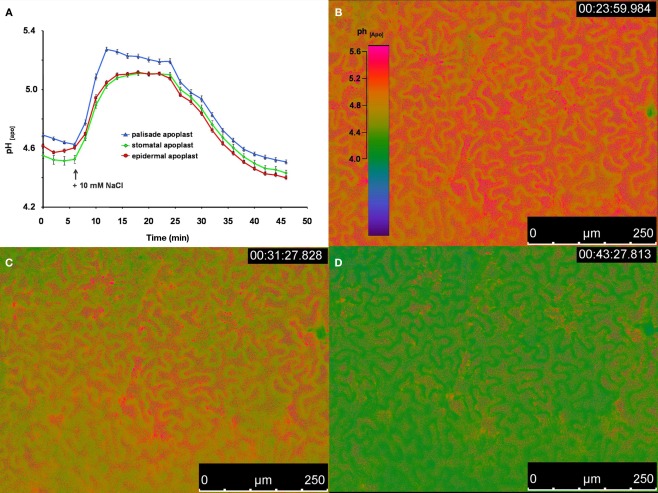
Ratiometric real-time quantitation of leaf apoplastic pH in response to the addition of 50 μL of a 10 mM NaCl solution onto the leaf. (A) pH as recorded at the adaxial face of Vicia faba leaves is plotted over time. Black arrow indicates the time of the addition of the 10 mM NaCl stress stimulus onto the surface of the leaf. Leaf apoplastic pH was discriminated within three apoplastic components, viz. in the stomatal cavity (n = 10 ROI; green kinetic; mean ± SE of ROIs), in the epidermal apoplast (n = 20 ROI; red kinetic; mean ± SE of ROIs) and in the apoplast surrounding the palisade mesophyll (n = 20 ROI; blue kinetic; mean ± SE of ROIs). Ratiometric images (B–D) show the time series of apoplastic leaf pH at (B) 23, (C) 31, and (D) 43 min after measurement had started (time of image acquisition is presented in the upper right corner of the ratio images). Ratios were color-coded on a spectral color scale (see lookup-table as inset in B). Representative kinetics of five equivalent recordings of plants gained from independent experiments.

