Figure 6.
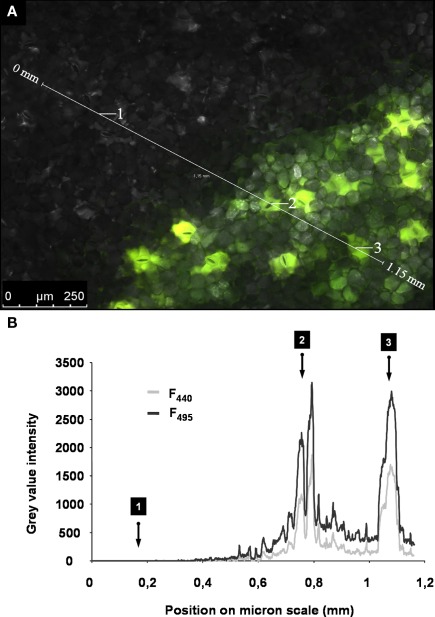
Specific dye signals versus unspecific noise signals. (A) Adaxial leaf face. Overlay of ex 495 nm pseudo-green fluorescence image, ex 440 nm pseudo-red fluorescence image, and the corresponding bright-field image (gray-scaled). The apoplast was partially loaded with the dye (lower right part of the image). Dye-loaded areas appear light green when illuminated, because pseudo-red and pseudo-green are mixed within the overlay. The gray area was not loaded with the dye (upper left part of the image). Such a specimen represents a suitable object to compare the amount of unspecific signals (noise) to specific signals being emitted from the dye. The intensity of gray values was chosen as a measure for signal intensity. A profile of the gray-value intensity was taken from the area tagged with the scale bar (1.15 mm length; white line in A) and is presented in (B). This profile is displayed for both fluorescence excitation channels (ex 495 and ex 440 nm). Negligible signals were emitted from the area of the leaf without dye (i.e., detail 1). The signals were much higher in the dye-loaded areas (i.e., detail 2 and 3; in both cases, signal intensity at stomatal cavity).

