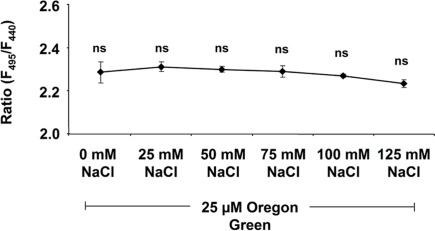
Figure 7.
Dependency of the Oregon Green 488 F495/F440 ratio on NaCl. Ratios are displayed against NaCl concentration. NaCl ranging from 0 to 125 mM was mixed into the dye solution (25 μM Oregon Green). Ratios were stable and thus not affected by NaCl. Values represent the mean ± SE (n = 4 biological replicates). t-Test revealed no significant mean differences at p ≤ 0.05.

