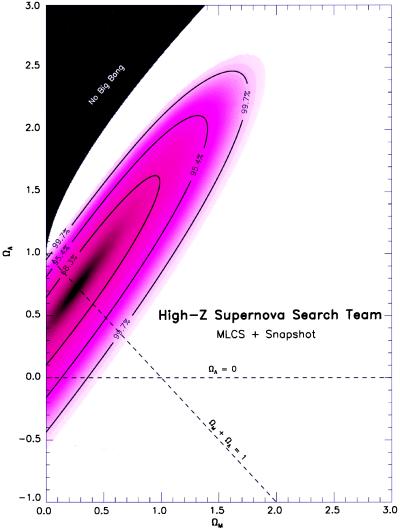
Figure 4.
The Ωm, ΩΛ plane. Using the supernova data, a likelihood analysis shows the probability that any chosen pair of Ωm, ΩΛ values fits the observations. The allowed region is large and follows the direction of Ωm − ΩΛ = a constant. Ωm = 1 is far from the allowed region. Many pairs of geometrically flat solutions with Ωm + ΩΛ = 1 are possible. ΩΛ = 0 is not very probable in this analysis.

