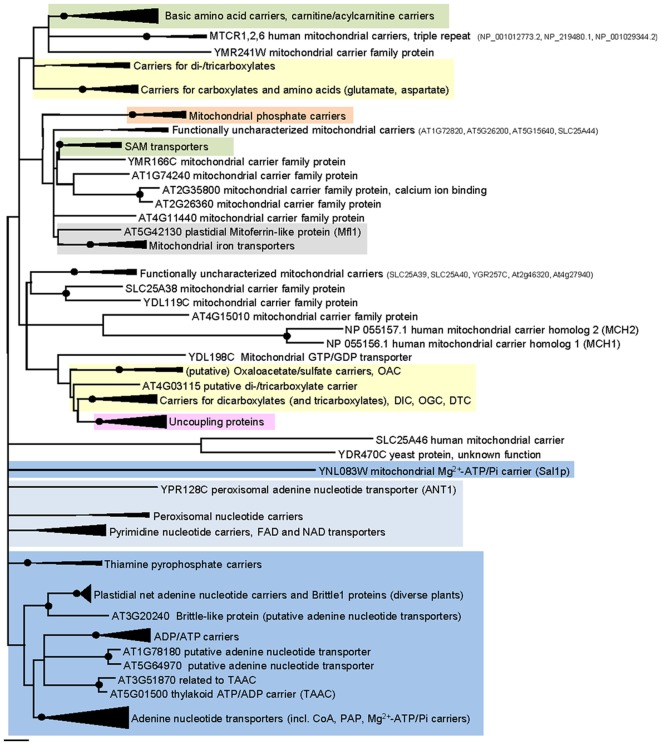
Figure 3.
Phylogenetic relationships of MCF proteins. A phylogenetic tree based on amino acid sequences of the MCF proteins from Homo sapiens, Saccharomyces cerevisiae, and Arabidopsis thaliana is shown. The tree was calculated with MEGA5 using the maximum likelihood treeing method and the JTT model of amino acid substitution. The analysis involved 164 amino acid sequences (Table S1 in Supplementary Material). All positions containing gaps and missing data were eliminated. There were a total of 147 positions in the final dataset. Nodes that are supported by bootstrap values (maximum likelihood and maximum parsimony, 1000 replications) higher than 70 are indicated by black dots. Different functional groups (clusters or sub-clusters) are shaded: basic amino acid carriers, carnitine/acylcarnitine carriers, and SAM transporters in green, carriers for carboxylates, dicarboxylates, tricarboxylates, glutamate, and aspartate in yellow, mitochondrial phosphate carriers in orange, iron transporters in gray, uncoupling proteins in purple, peroxisomal ADP/ATP carriers, pyrimidine nucleotide, FAD, and NAD carriers in very pale blue, adenine nucleotide and thiamine pyrophosphate transporters transporters in blue). The shaded subsets are displayed in detail in Figures A1–A5 in Appendix.

