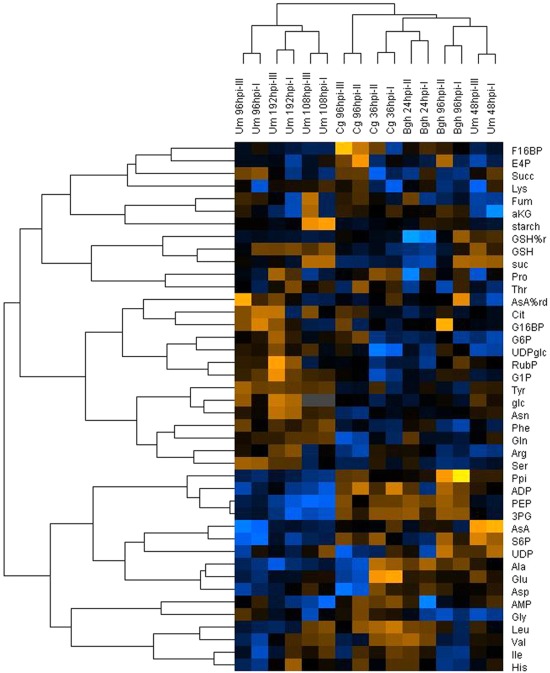
Figure 2.
Hierarchical cluster analysis of metabolome data from infected leaves. Mean values of metabolite contents from four biological replicates of infected and mock control leaves harvested at the indicated time points after infection with the respective pathogens (Bgh, Blumeria graminis f.sp. hordei; Cg, Colletotrichum graminicola; Um, Ustilago maydis) were used to calculate the metabolite ratio infected/mock for the indicated experimental replicates. After log transformation of the data, median centered ratios were normalized and hierarchical clustering analysis (HCA) was performed using the complete linkage algorithm of the program Cluster v2.11 (Eisen et al., 1998 – www.eisenlab.org) and the results were visualized using Maple Tree (http://mapletree.sourceforge.net/). Metabolite ratios from two independent experiments (indicated by Roman numbers) of every pathosystem were used for HCA. Color intensity correlates with degree of increase (yellow) and decrease (blue) relative to the mean metabolite ratio. hpi, hours post infection. Amino acids and nucleotides are abbreviated according to three letter code, aKG, (α-ketoglutarate) Asc (ascorbate); %AsA red, (% reduced ascorbate); Cit, (citrate); E4P, (erythrose-4-phosphate); F16BP, (fructose-1,6-bisphosphate); F6P, (fructose-6-phosphate); frc, (fructose); Fum, (fumarate); G16BP, (glucose-1,6-bisphosphate); G1P, (glucose-1-phosphate); G6P, (glucose-6-phosphate); glc, (glucose); GSH, (glutathione); %GSH red, (% glutathione reduced); Icit, (isocitrate); PEP, (phosphoenol pyruvate); 3PG, (3-phosphoglycerate); 6PG, (6-phosphogluconate); Ppi, (pyrophosphate); Pyr, (pyruvate); RubP, (ribulose-1,5-bisphosphate); S6P, (sucrose-6-phosphate); suc, (sucrose); Succ, (succinate); T6P, (trehalose-6-phosphate); UDPglc, (UDP-glucose).

