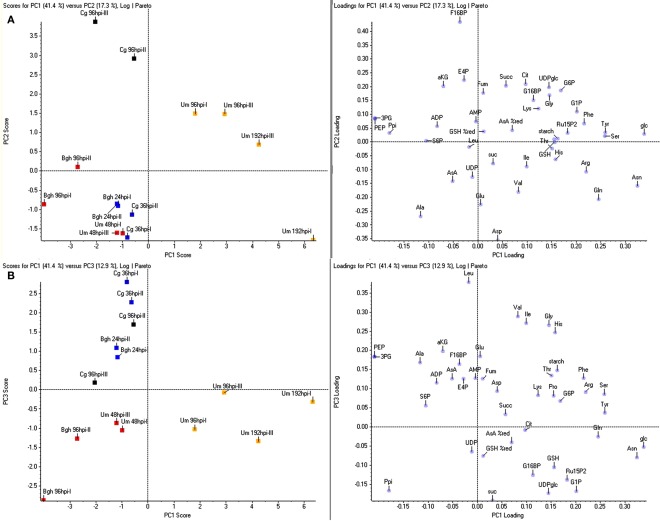
Figure 3.
Principle component analysis of metabolite data. For principle component analysis (PCA), the same metabolite ratios as in Figure 1 were used, representing the ratio infected/mock calculated from the mean values of four sample replicates each. Per pathosystem, data from two independent experiments (designated by Roman numbers) were employed for PCA. (A) PC1 vs. PC2. (B) PC1 vs. PC3. Bgh, Blumeria graminis f.sp. hordei; Cg, Colletotrichum graminicola; Um, Ustilago maydis; yellow, tumor, red, established biotrophy, blue, early biotrophy, black, necrotrophy. Amino acids and nucleotides are abbreviated according to three letter code, aKG, (α-ketoglutarate) AsA (ascorbate); %AsA red, (% reduced ascorbate); Cit, (citrate); E4P, (erythrose-4-phosphate); F16BP, (fructose-1,6-bisphosphate); F6P, (fructose-6-phosphate); frc, (fructose); Fum, (fumarate); G16BP, (glucose-1,6-bisphosphate); G1P, (glucose-1-phosphate); G6P, (glucose-6-phosphate); glc, (glucose); GSH, (glutathione); %GSH red, (% glutathione reduced); Icit, (isocitrate); PEP, (phosphoenol pyruvate); 3PG, (3-phosphoglycerate); 6PG, (6-phosphogluconate); Ppi, (pyrophosphate); Pyr, (pyruvate); RubP, (ribulose-1,5-bisphosphate); S6P, (sucrose-6-phosphate); suc, (sucrose); Succ, (succinate); T6P, (trehalose-6-phosphate); UDPglc (UDP-glucose).

