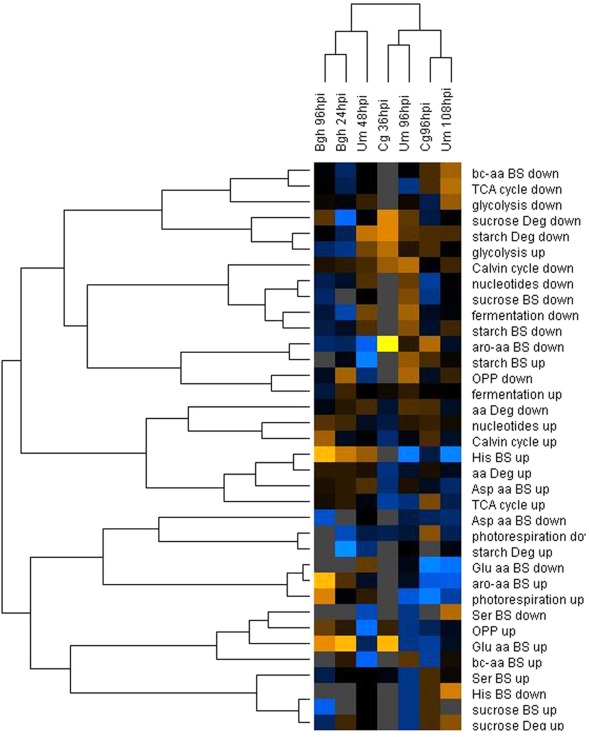
Figure 4.
Hierarchical cluster analysis of MapMan BIN enrichment. The percentage of up- and down-regulated genes in each MapMan BIN was calculated based on the mean fold changes from all three replicate experiments. After log transformation of the data, median centered percentages were normalized and hierarchical clustering analysis (HCA) was performed using the complete linkage algorithm of the program Cluster v2.11 (Eisen et al., 1998 – www.eisenlab.org) and the results were visualized using Maple Tree (http://mapletree.sourceforge.net/). Color intensity correlates with degree of increase (yellow) and decrease (blue) relative to the BIN mean of all samples, while gray corresponds to 0% regulated genes in the MapMan BINs. Bgh, Blumeria graminis f.sp. hordei; Cg, Colletotrichum graminicola; Um, Ustilago maydis; hpi, hours post infection. Amino acids are abbreviated by three letter code; aro-aa, aromatic amino acids; bc-aa, branched-chain amino acids; BS, biosynthesis; Deg, degradation; OPPP, oxidative pentose phosphate pathway.

