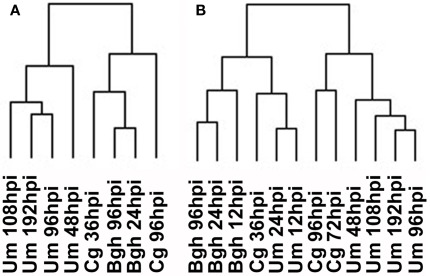
Figure 5.
Hierarchical cluster analysis of whole transcriptome data. (A) HCA for the timepoints analyzed in this report. (B) HCA for all timepoints sampled. Barley and maize Affymetrix data were matched via PlexDB (www.plexDB.org) as described in the methods section and the mean transcript fold changes of infected vs. mock samples were calculated based on all three replicate experiments and were subsequently used for HCA. After log transformation of the data, median centered data were normalized and hierarchical clustering analysis (HCA) was performed using the complete linkage algorithm of the program Cluster v2.11 (Eisen et al., 1998 – www.eisenlab.org) and the results were visualized using Maple Tree (http://mapletree.sourceforge.net/). Bgh, Blumeria graminis f.sp. hordei; Cg, Colletotrichum graminicola; Um, Ustilago maydis; hpi, hours post infection.

