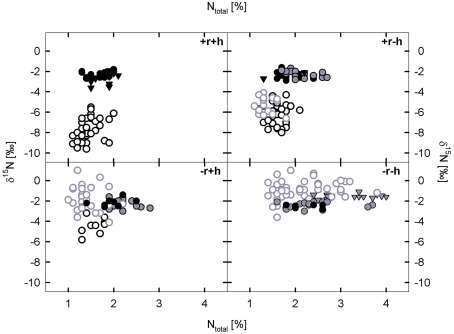
Figure 3.
The relationship between δ15N values and N concentration [%] in leaves of six plant species across four restoration treatment. Restoration treatments are: with topsoil removal and hay transfer (+r+h), with topsoil removal and without hay transfer (+r−h), without topsoil removal and with hay transfer (−r+h), without topsoil removal and without hay transfer (−r−h). Closed symbols indicate legume species, open symbols non-legume species; black symbols indicate target species: Anthyllis vulneraria (●) and Dorycnium germanicum (▼), Helianthemum nummularium (black-open: ^) and gray symbols indicate mesic, non-target species: Lotus corniculatus ( ), Trifolium pratense (
 ) and Galium mollugo (
 ). Every symbol in this figure represents one replicate per species and restoration treatment, mean values are given in Figure 3, neighborhood effects of legumes on non-legume species are shown in Figure 4.

