
Figure 6.
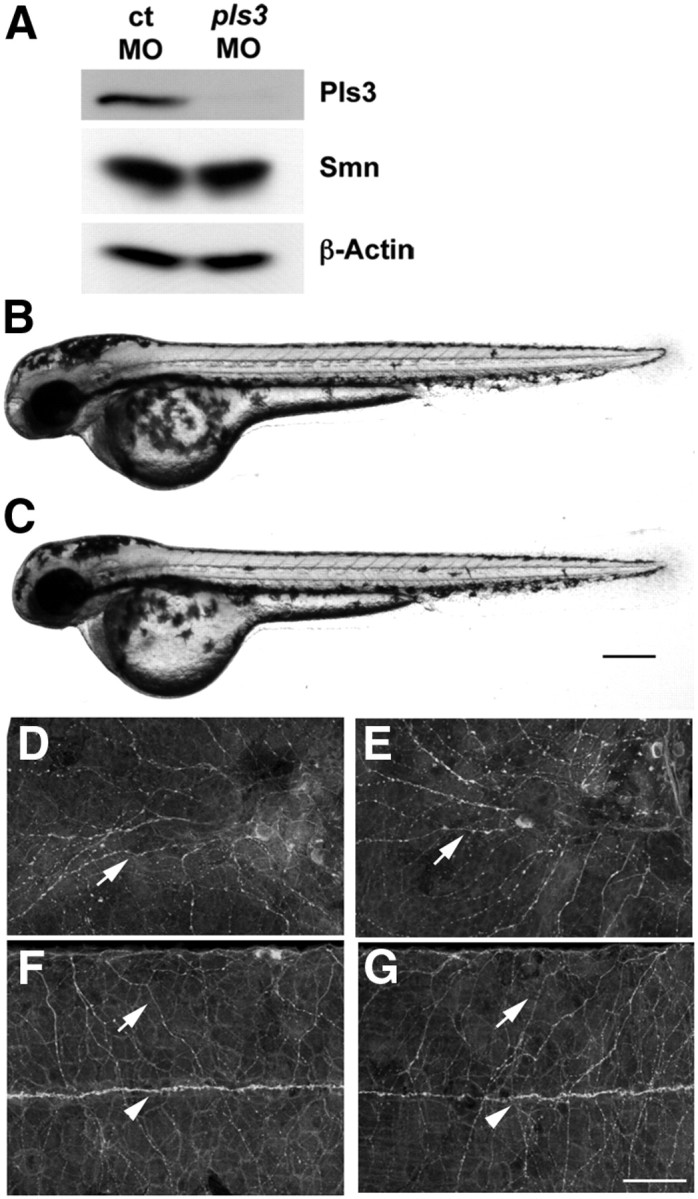
pls3 morphants develop normally. A, Western blot of protein from 1 dpf control (ct) and pls3 MO-injected embryos. Lateral views of 2 dpf live control (B) and pls3 (C) morphants. Acetylated tubulin labeling showing trigeminal sensory axons (D, E, arrows), Rohon–Beard sensory axons (F, G, arrows), and the lateral line nerve (F, G, arrowheads) in 2 dpf control (D, F) and pls3 (E, G) morphants. Scale bars: (in B) B, C, 120 μm; (in G) D–G, 50 μm.