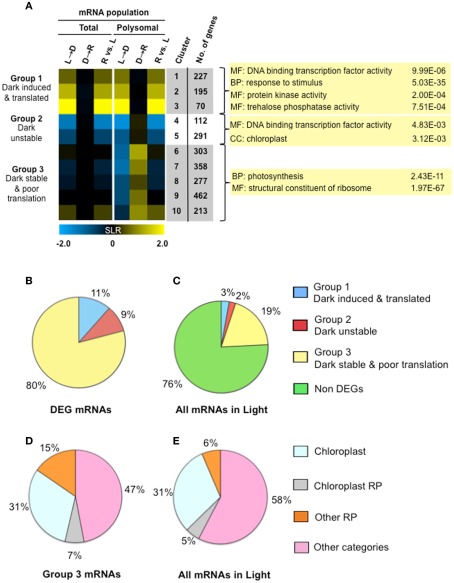
Figure 6.
Light availability alters both transcript accumulation and translational status as a mechanism of energy conservation. (A) Fuzzy k-mean clustering analysis performed on six mean signal log ratio (SLR) comparisons of total and immunopurified polysomal mRNA transcript abundance. Genes included in the analysis were those without all “absent” calls and significantly different in abundance (FDR <0.05; n = 2508 probe pair sets). The comparisons and genes evaluated are the same as those represented in Figure 3 (Table S1A in Supplementary Material). The heatmap shows median SLR values for each of 10 clusters of mRNAs that displayed similar responses to light availability based on the total and polysomal mRNA populations; color indicates increase (yellow), decrease (blue) or no-change (black) in mRNA abundance. Columns indicate cluster ID, number of genes (No. genes). Selected gene ontology (GO) categories (p-values calculated by GOHyperGAll) from three groups of coordinately regulated genes are shown. Pie charts in (B,C) represent the percentage of total cellular mRNAs in seedlings in the light, as determined from average signal values. (B) The proportion of total cellular mRNA of contrastingly regulated gene clusters; differential expressed gene (DEG) mRNAs in groups shown in (A). (C) Proportion of total cellular mRNA of the three groups of DEGs represented in (A). (D) Percentage of cellular mRNA content in Clusters 6–10 (19% of the total cellular mRNA in the light) that encodes genes annotated as chloroplast localized, chloroplast ribosomal protein (RP), cytosolic, or mitochondrial ribosomal protein (Other RP) or some other category of molecular function or location. (E) Proportion of total cellular mRNA of the four classes of genes evaluated in (D).

